7-clicks from image to analysis
| Level | Introductory |
| Functionality | Loading, Segmentation, Visualization |
| Time | <2 min |
| Image | Kidney_Cortex_Human.tif
 |
This short sketch demonstrates how to analyze an image in VTEA with only seven mouse-clicks. There are four steps in 7-clicks:
- Start VTEA: 2-clicks
- Load an image: 1-click
- Process an image: 1-click
- Segment an image: 3-clicks
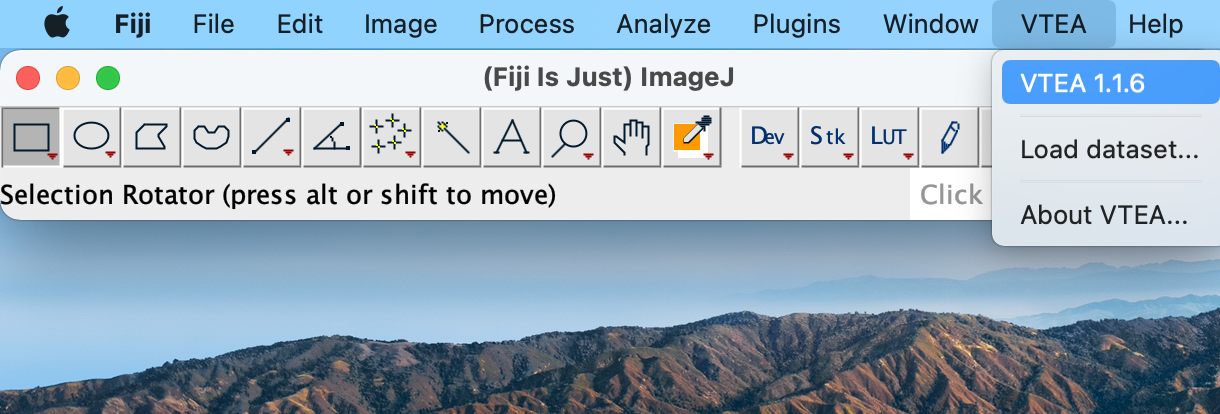
Step 1: Start VTEA…
|
VTEA runs as a FIJI (ImageJ) plugin. Once VTEA is installed, select the VTEA menu (Click #1) and then "VTEA 1.1.6" (Click #2). The version number will change with ongoing updates.
|
|
|
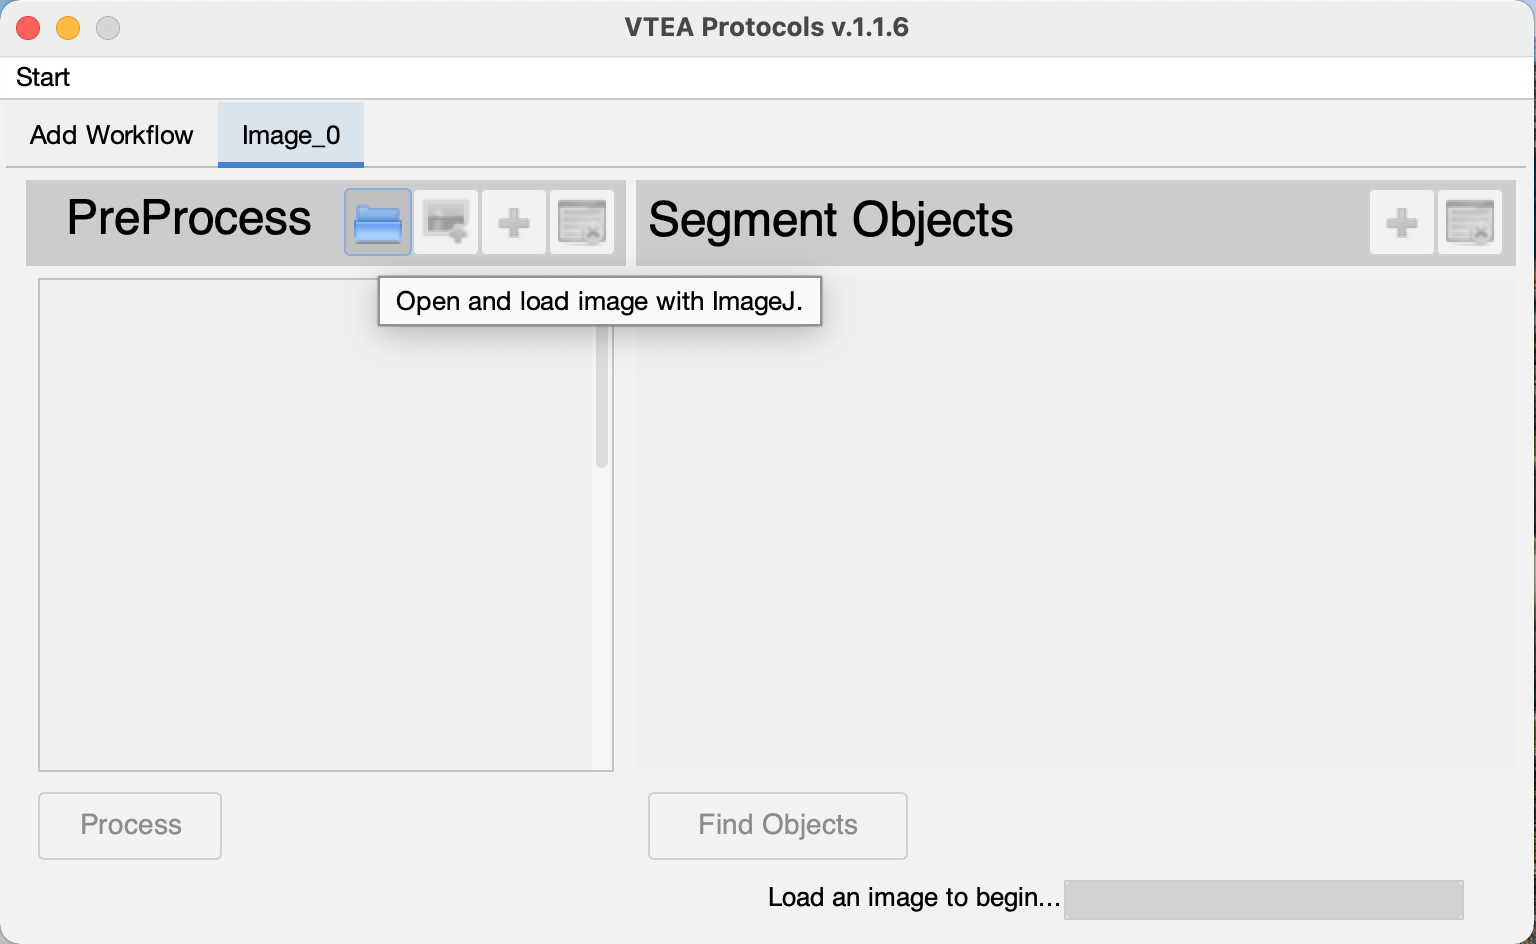
Step 2: Load an image…
If no images are open in FIJI/ImageJ, use the open image button  (Click #3). This will open up a standard FIJI open image file menu and automatically load an image into the VTEA workflow. (Click #3). This will open up a standard FIJI open image file menu and automatically load an image into the VTEA workflow.
|
|
|
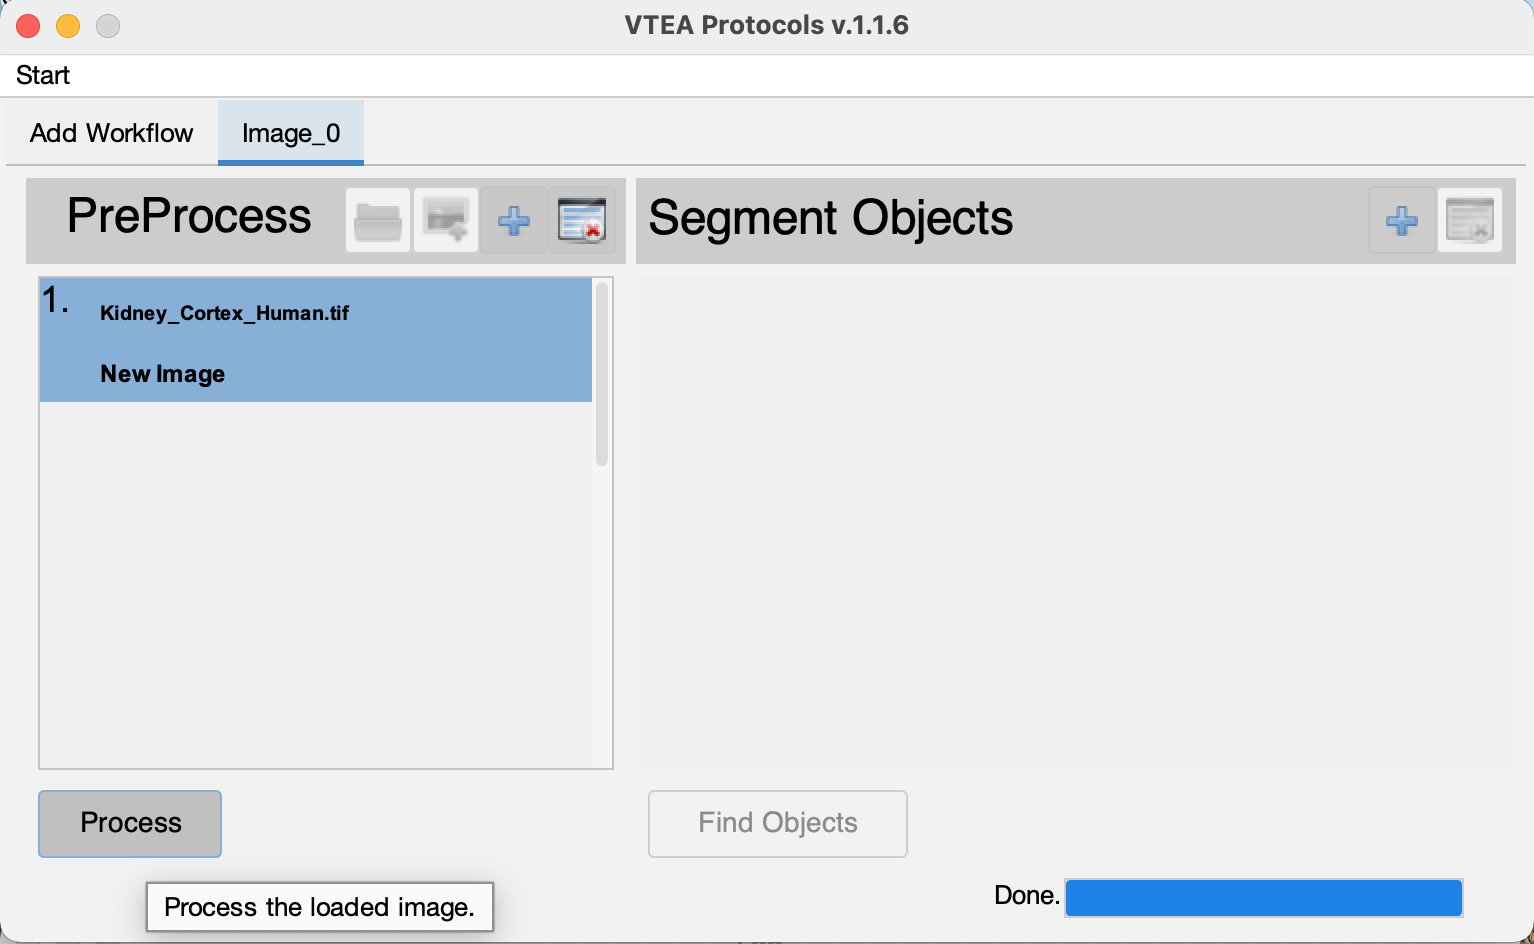
Step 3: Process an image…
If the image quality is sufficient for segmentation, preprocessing can be skipped by selecting:  (Click #4). A separate sketch describes image processing and VTEA's functionality including combining image processing steps and previewing. (Click #4). A separate sketch describes image processing and VTEA's functionality including combining image processing steps and previewing.
|
|
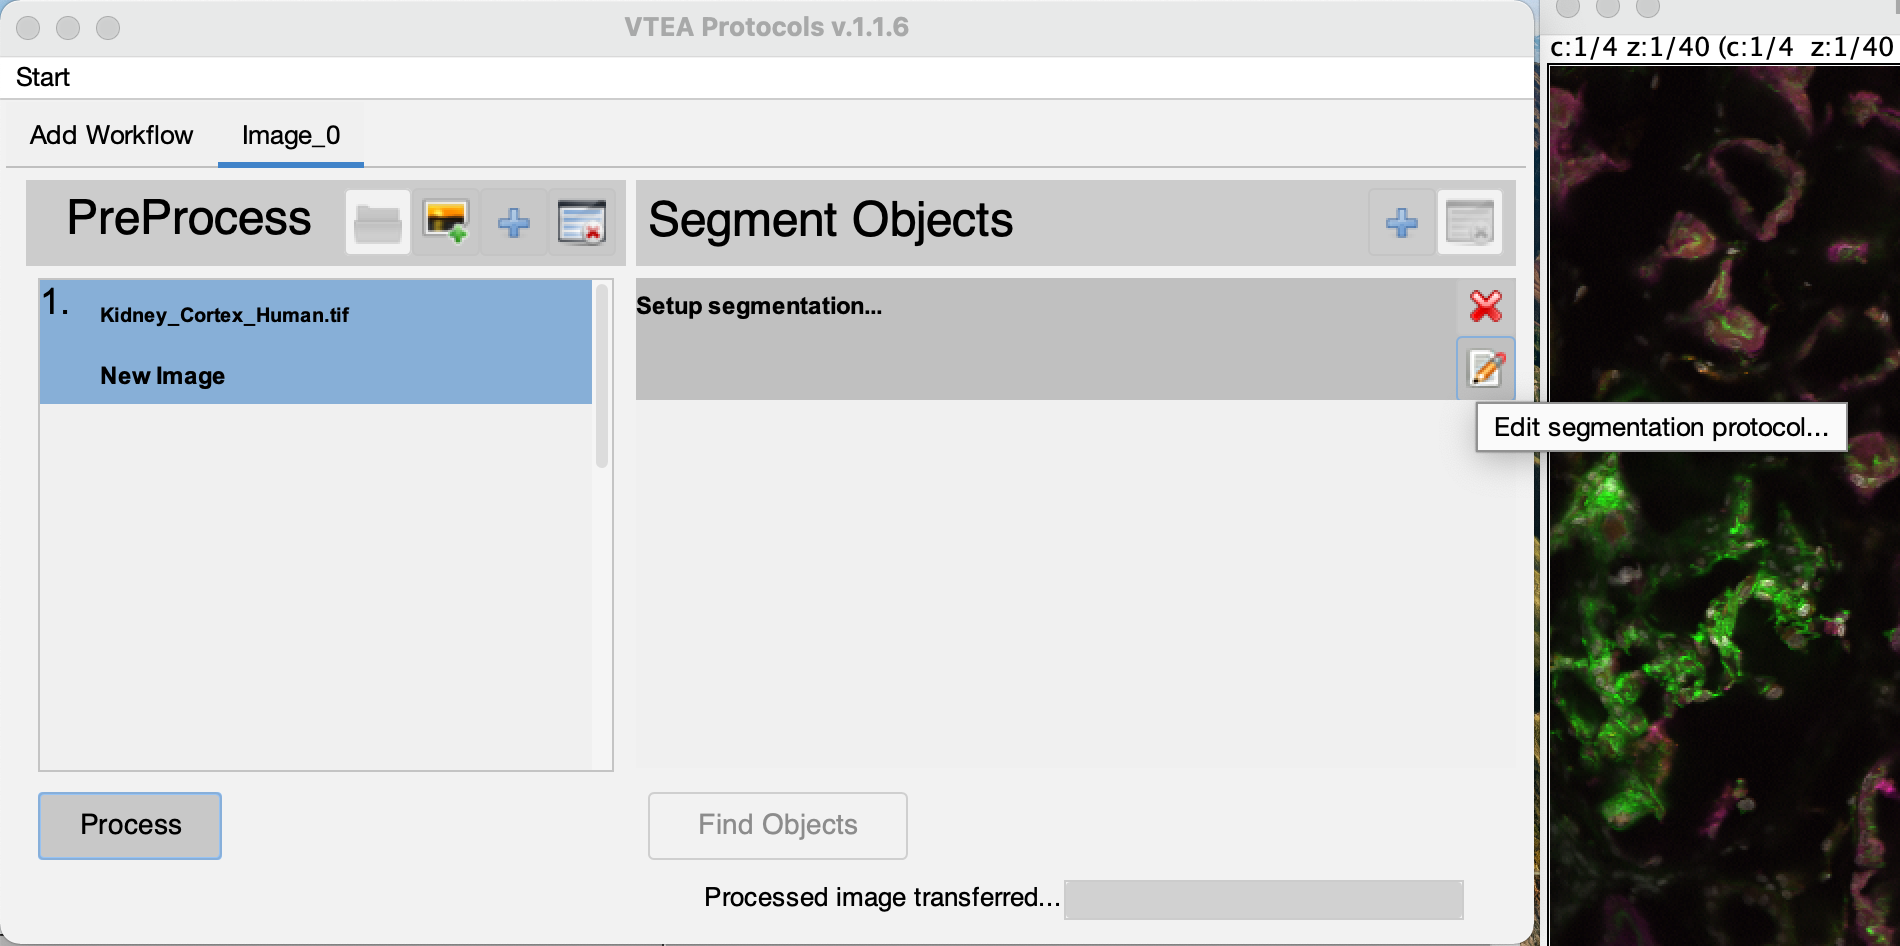
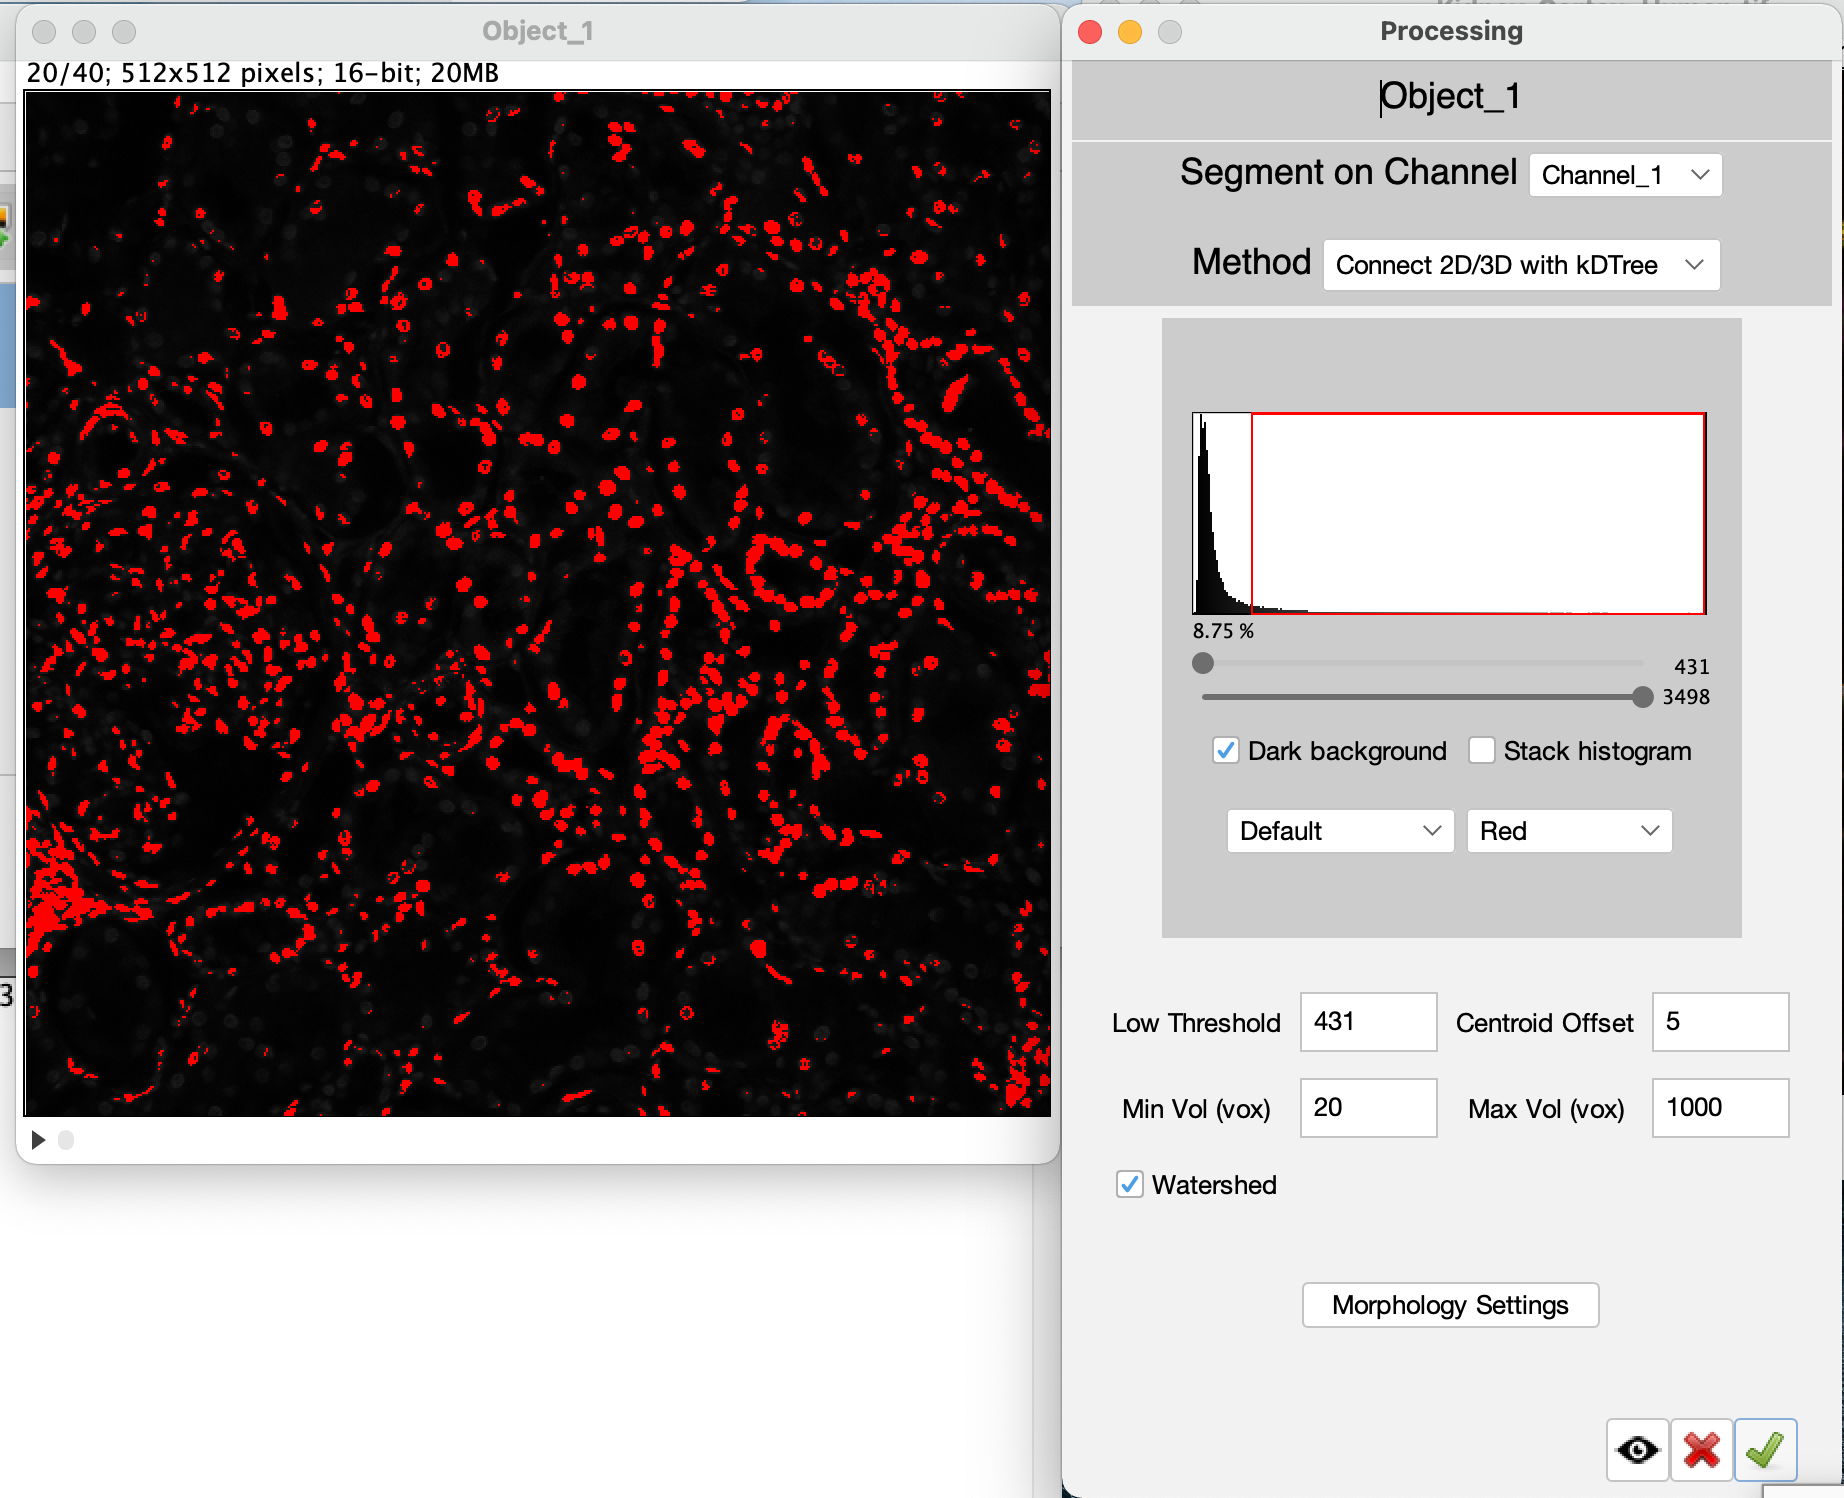
Step 4: Segment an image…
The processed image is automatically moved to the segmentation setup after the image processing steps are completed. A image is also generated by the image processing steps that may be closed. The original image can also be closed at this time. Select the edit settings button  (Click #5), to set and adjust the segmentation settings.
</tr> (Click #5), to set and adjust the segmentation settings.
</tr> |
|
|
Two windows are used to setup segementation in VTEA, the settings window and, if applicable, a threshold preview. Segementation can be previewed by drawing an ROI on the threshold preview and selecting the eye button,  . VTEA's default segmentation (in 2D or 3D) is a connected components approach that uses pixel intensity or threshold calculations to segment 2D regions with watershed spliting and in 3D fuses overlapping 2D regions based on the distance between centroids of nearby 2D regions. To continue close the setup window by clicking on the green checkmark button . VTEA's default segmentation (in 2D or 3D) is a connected components approach that uses pixel intensity or threshold calculations to segment 2D regions with watershed spliting and in 3D fuses overlapping 2D regions based on the distance between centroids of nearby 2D regions. To continue close the setup window by clicking on the green checkmark button  (Click #6). To start the segmentation select the "Find Objects" button, (Click #6). To start the segmentation select the "Find Objects" button,  (Click #7). (Click #7).
|
|
</table>
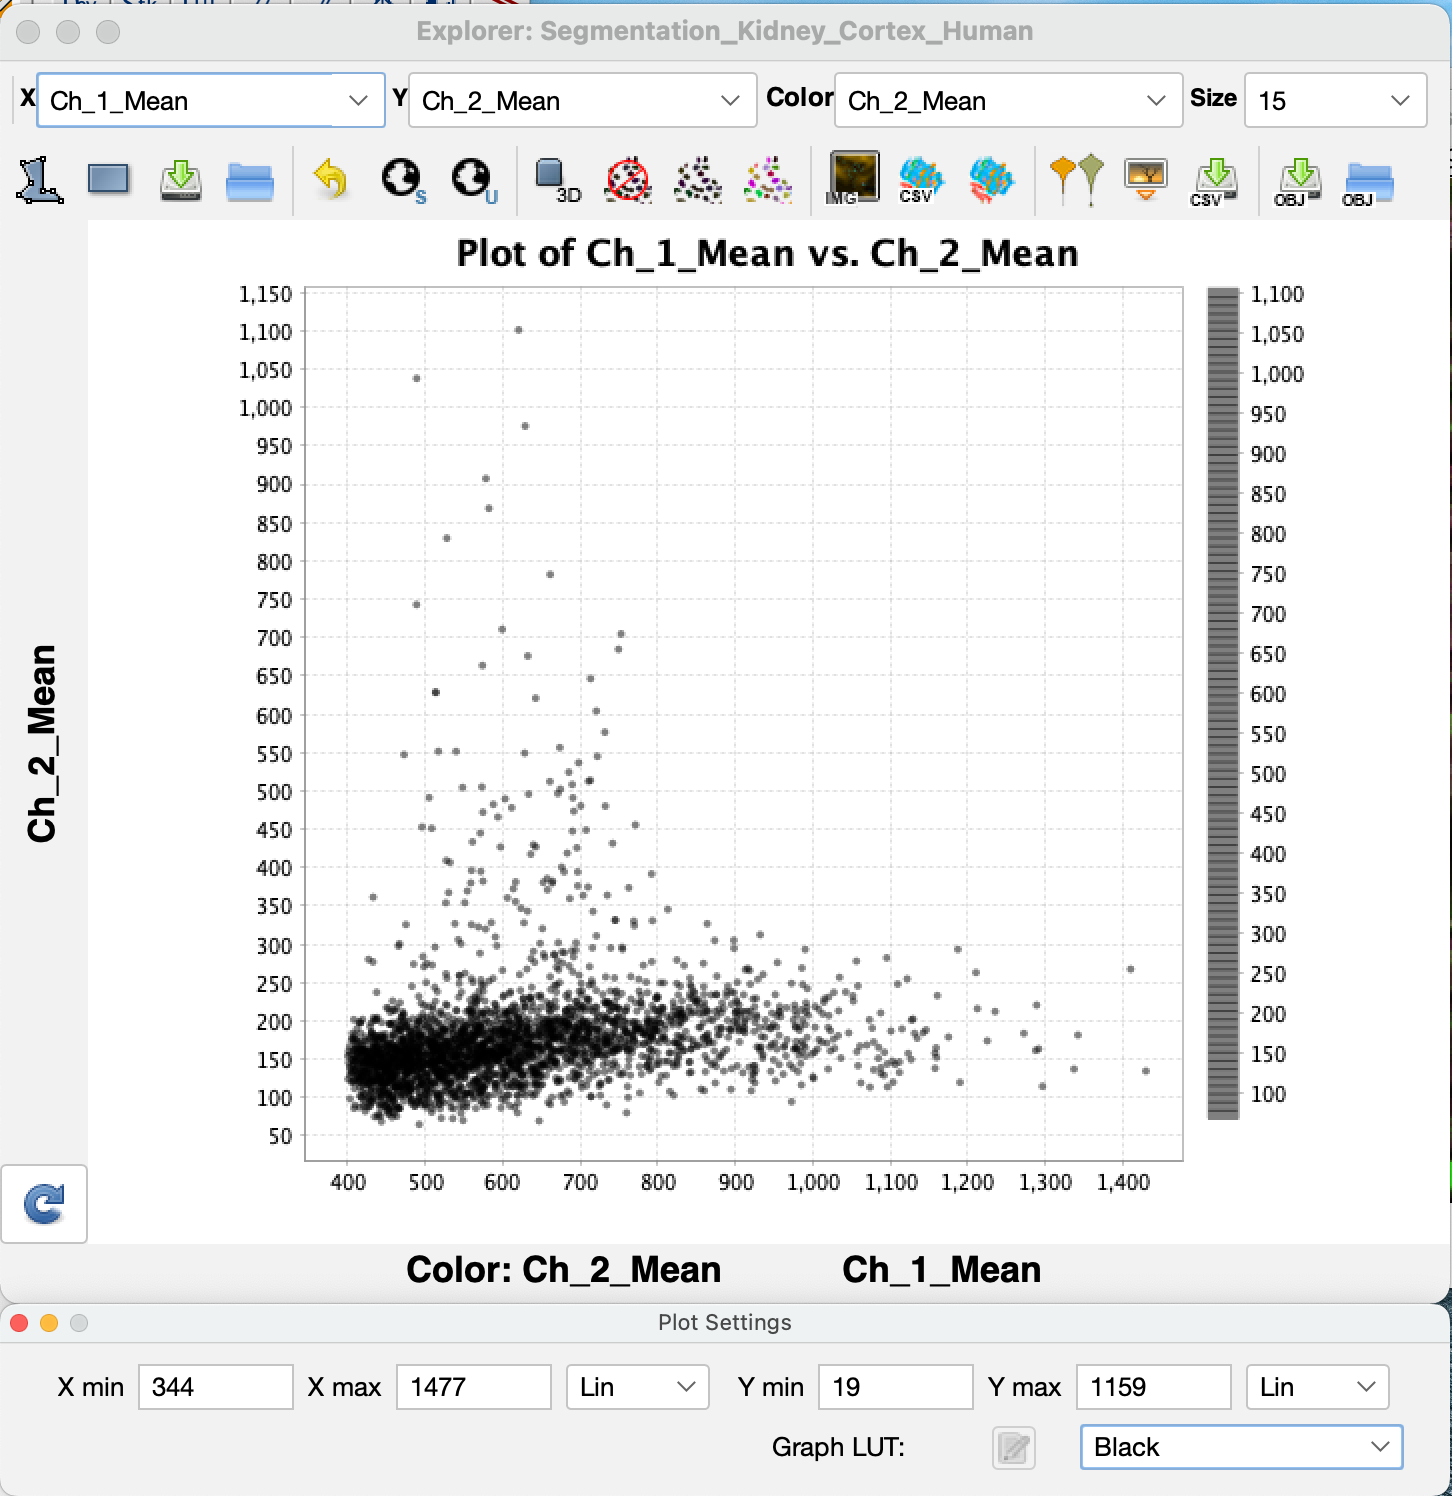
## Analyze results...
|
Once the segmentation and measurements are made on each segmented nucleus, VTEA's MicroExplorer window opens with a scatter plot of the processed data. In this scatter plot every dot represents a segmented cell. Where the dot is ploted is dependent upon the measured features plotted on the two axes and set by the drop-down menus for **X**, **Y** and **Color** respectively. Gating, quantitative analysis and cell classification using machine learning are covered in additional sketches.
|
|